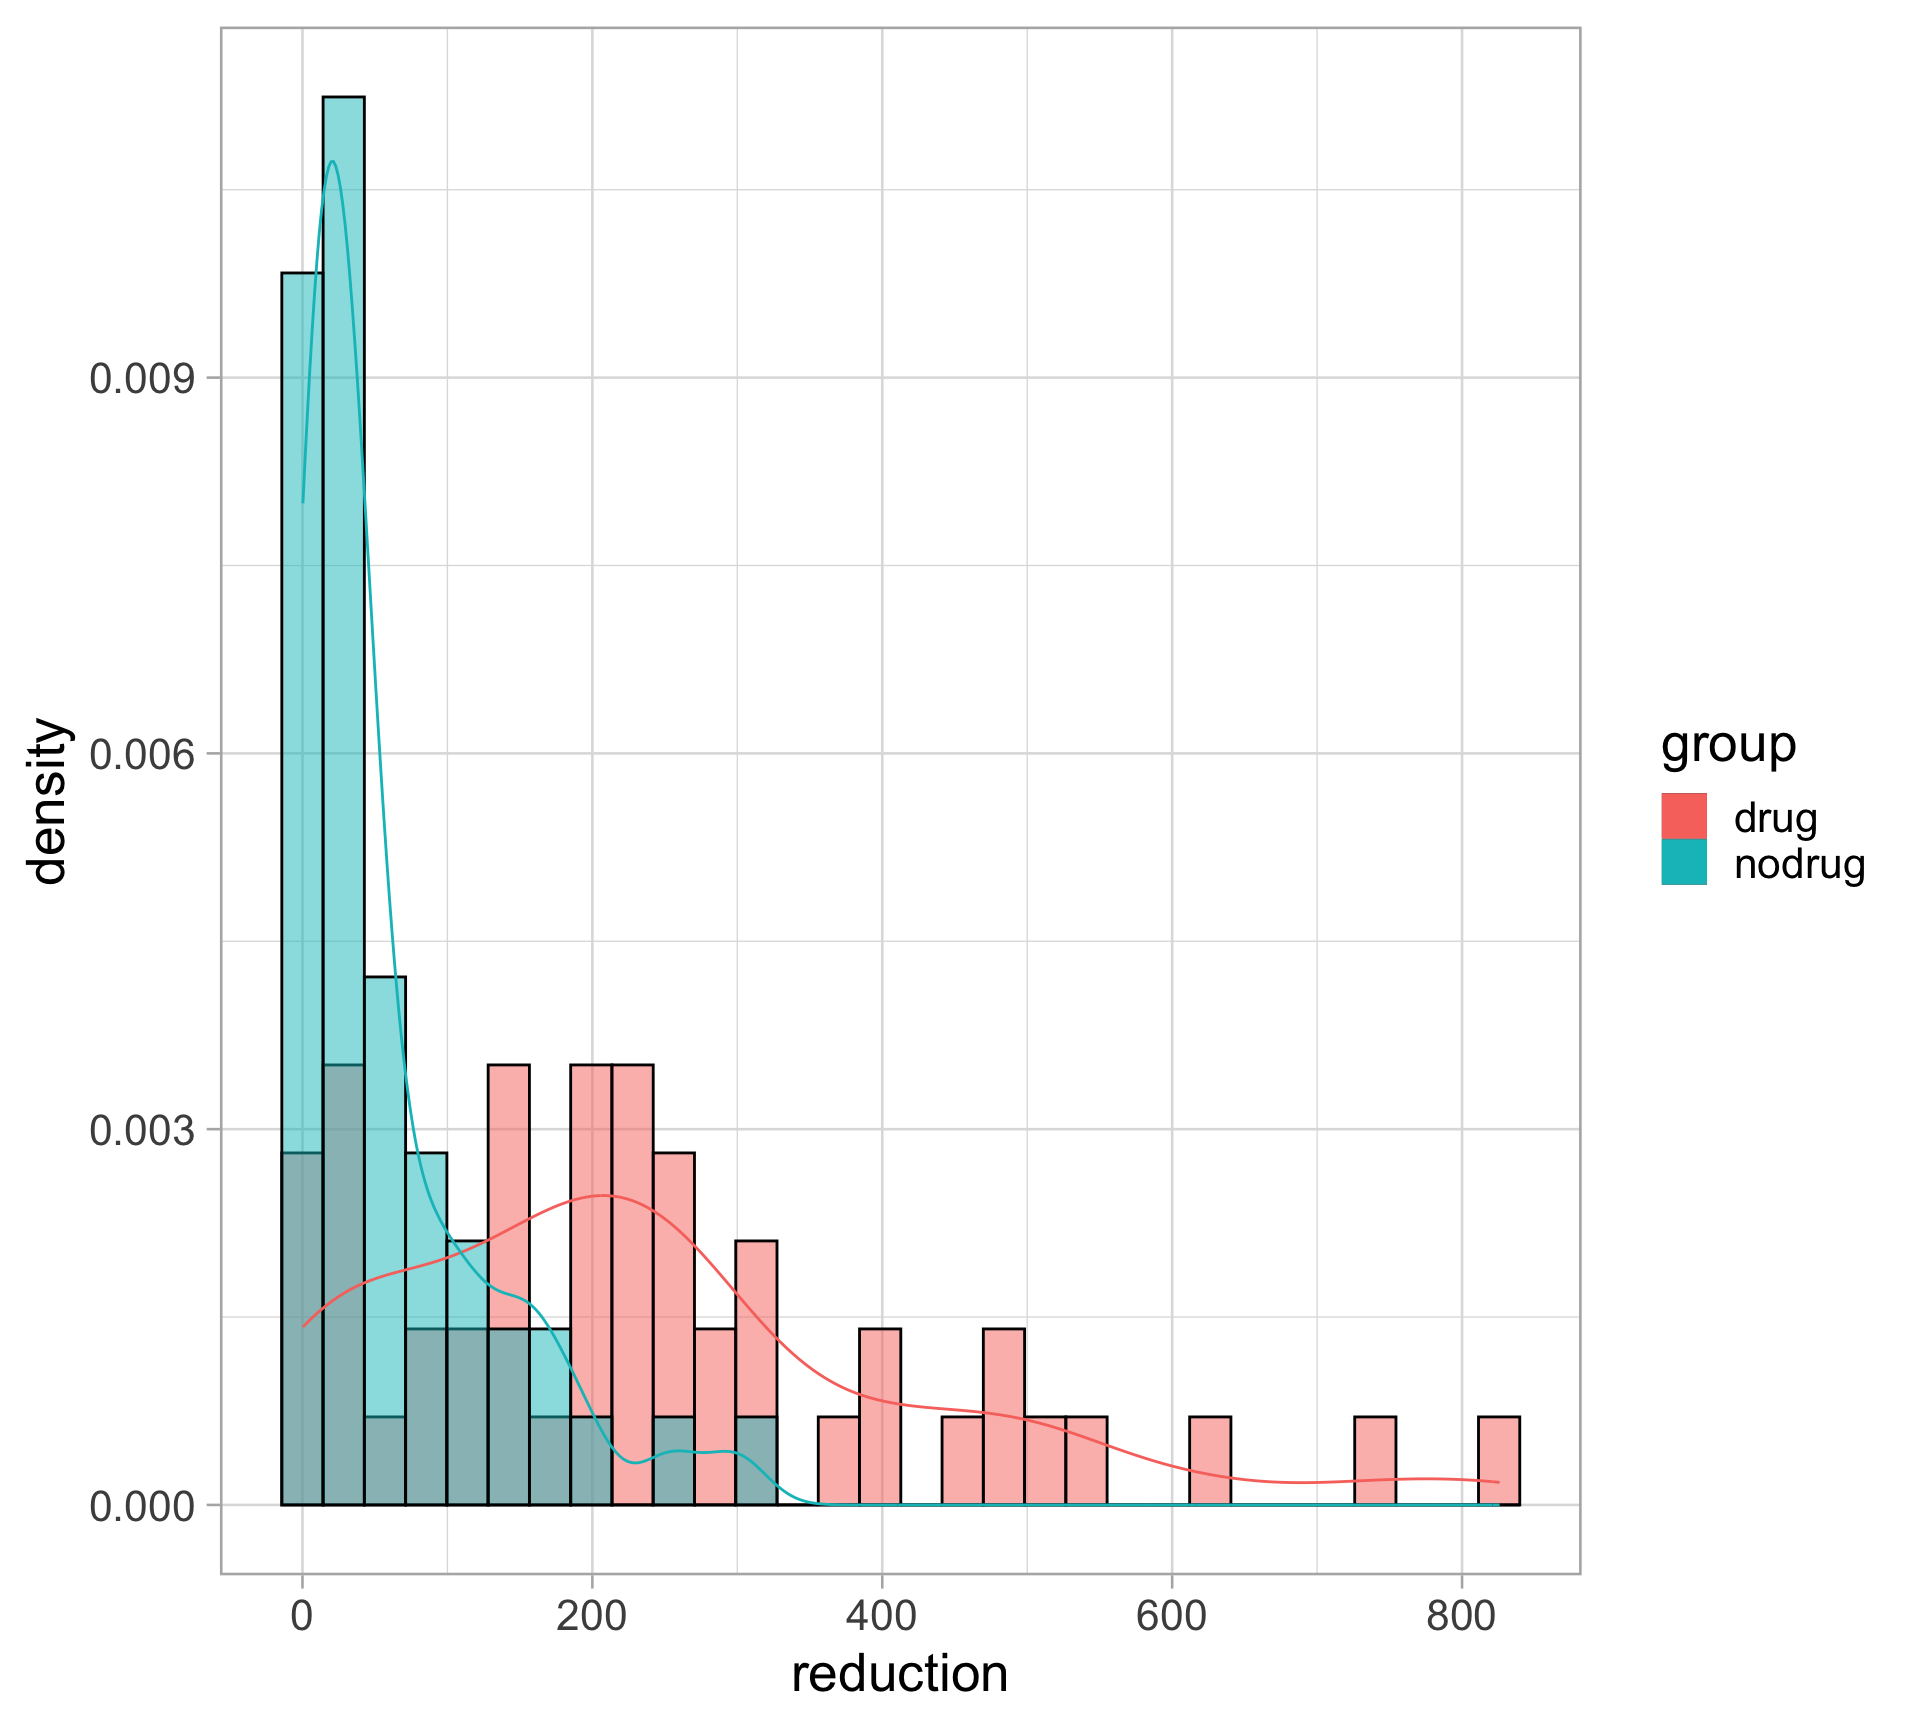
# suppose each group has 50 subjects
set.seed(100)
n_subjects <- 50
mean_drug <- 2
mean_nodrug <- runif(n_subjects, 0, 1)
x_drug <- 100 * rexp(n_subjects, 1 / mean_drug)
x_nodrug <- 100 * rexp(n_subjects, 1 / mean_nodrug)

tibble(x_drug, x_nodrug) |>
  pivot_longer(everything(),
               names_to = "group",
               names_prefix = "x_",
               values_to = "reduction") |>
  ggplot(aes(x = reduction, y = after_stat(density),
             color = group)) +
  geom_histogram(aes(fill = group),
                 alpha = 0.5, color = "black",
                 position = "identity") +
  geom_density(aes(color = group))